Reports for every part of your operation

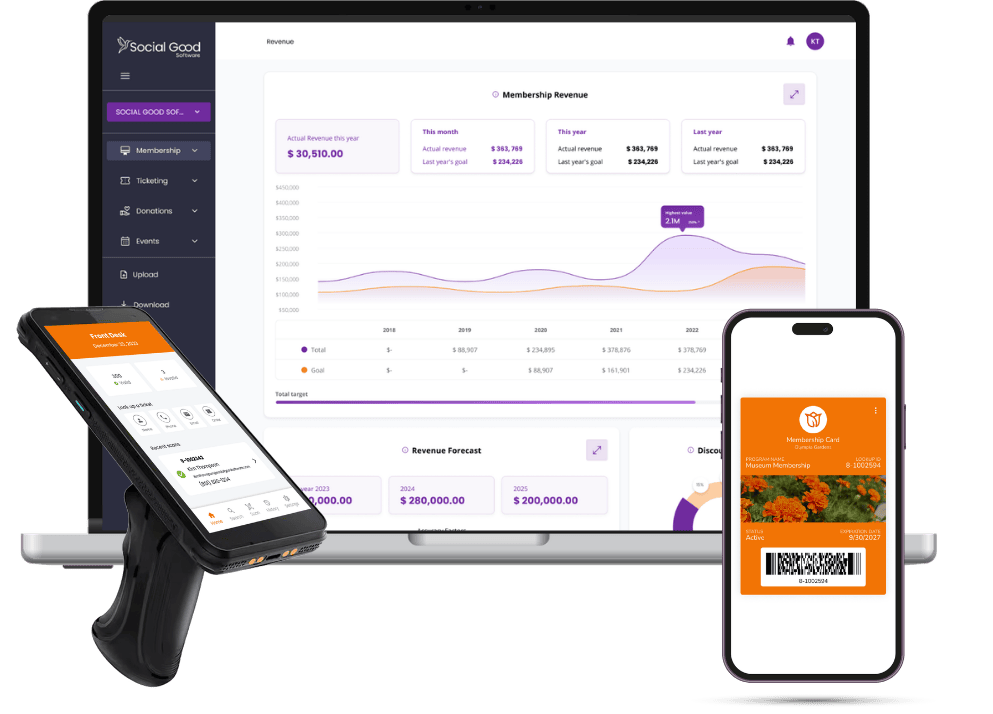
One dashboard for tickets, memberships, donations, and events
Your four main revenue channels each report separately. Admissions numbers in one tool, membership renewals in another, donation totals in a third. Building a complete picture means pulling from all of them.
Social Good runs all four on the same platform, so the report is already built – no exports, no reconciliation.
✓ Admissions revenue, capacity, and attendance by date
✓ Membership income, renewal rates, and lapsed member counts
✓ Donation totals by campaign, fund, and donor segment — plus event revenue alongside everything else
Operational reports for every part of your team
Your box office, marketing, and development teams all need different data – and right now they’re each pulling it from a different place, in a different format, on a different schedule.
Social Good gives every team the reports they need – all from the same source of truth.
✓ POS close-out reports by register, shift, and payment type
✓ Marketing campaign performance tied to actual ticket and donation revenue
✓ CRM activity reports — constituent records, segments built, and outreach sent


Reports that connect the full picture
You can see revenue numbers in isolation – but not what’s driving them. Not how a first-time visitor becomes a member, or how a member becomes a major donor.
Social Good connects activity across every feature so you can see the story behind the numbers, not just the totals.
✓ Constituent lifetime value across tickets, memberships, and donations
✓ Visitor-to-donor and visitor-to-member conversion tracking
✓ Marketing attribution tied to real ticket sales and donation outcomes
COMPARISON
Every reporting headache, handled
The problem
✗Revenue pulled from multiple systems manually
✗Board reports take days to assemble
✗No visibility into revenue by time of day
✗Member retention rates calculated in Excel
✗Can’t connect marketing spend to revenue
✗Ticket sales reports separate from membership reports
✗Data exports require IT or vendor support
✗No live dashboards for daily operations
✗School group and program reports tracked separately
✗Financial reconciliation done manually
How we solve it
✓One dashboard with cross-channel revenue in real time
✓Custom reports built and scheduled in minutes
✓Sales by hour, day, week, and custom date ranges
✓Renewal rates, upgrades, and downgrades tracked automatically
✓Campaign ROI with direct revenue attribution
✓Every revenue stream in one unified view
✓Self-service exports to Excel and CSV
✓Real-time dashboards accessible to your whole team
✓Education and program reporting alongside admissions
Part of a complete platform
Every channel runs on one system, one CRM, and one constituent record.
Ticketing & Admissions
Sell tickets across channels, manage timed entry, and handle every transaction from one inventory.
Learn more →
Membership Management
Sell memberships, automate renewals, and apply member-only pricing across the platform.
Learn more →
Donations & Fundraising
Process gifts, recurring donations, and grants. Every transaction is tied to a constituent record.
Learn more →
Event Management
Lectures, exhibits, fundraisers, and member events ticketed in the same system as admissions.
Learn more →
Field Trips & Group Sales
School trips, custom group bookings, and chaperone management on one shared inventory.
Learn more →
Point of Sale & Terminals
Register-grade POS for shops, cafes, and admissions, synced to your CRM in real time.
Learn more →
See it in action
Get started with Social Good
Schedule your one on one demo to see the software in action.
Get started